Descubra como desenvolvemos essas ferramentas.
Descubra como clientes LUZ atingiram o sucesso com nossas ferramentas.
Manage your subscription details.
Members-only page to download spreadsheets and presentations templates.
Descubra como desenvolvemos essas ferramentas.
Descubra como clientes LUZ atingiram o sucesso com nossas ferramentas.
Manage your subscription details.
Members-only page to download spreadsheets and presentations templates.
Discover how we built our tools
Our Customers Success Stories are our Success
Discover how we built our tools
Our Customers Success Stories are our Success
Manage your subscription details.
Members-only page to download spreadsheets and presentations templates.
Manage your subscription details.
Members-only page to download spreadsheets and presentations templates.
Enjoy all benefits of a LUZ Templates subscription:
Gain productivity in your consulting services with ready-to-use templates
Already a member? Download this template in the member’s area
Analysis for 3 years
When you purchase this worksheet you will receive an Excel file with an analysis version for 3 years.
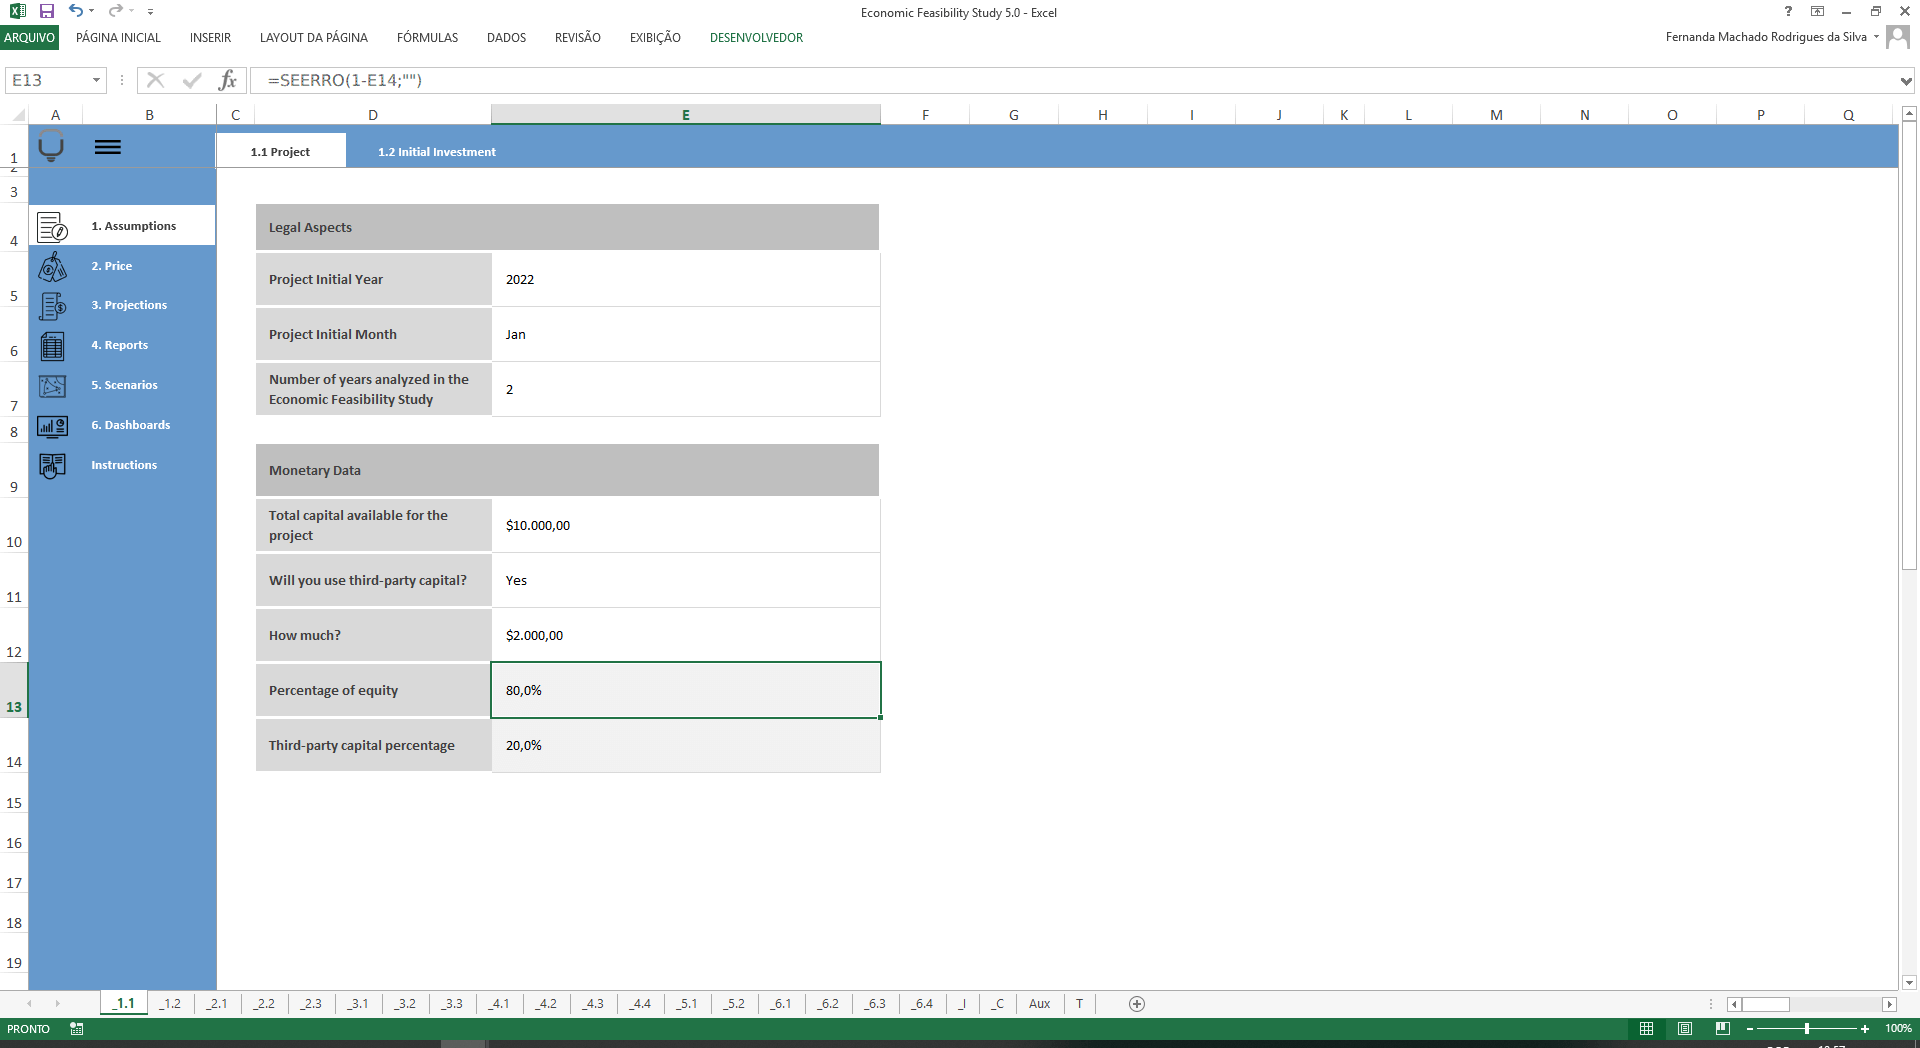
Availability of capital
The spreadsheet will indicate how much capital you have available to invest in the project and will automatically tell you if this capital is sufficient according to the projections you made.
Initial Investments
The first step for a Feasibility Study is to identify your initial costs and in this worksheet, you can put each of them in detail. In addition, you can add a periodic depreciation rate.
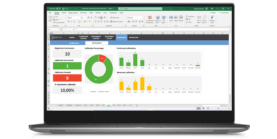
Capital Availability Dashboard
According to the data you fill in the worksheet, find out how many months you can stay negative with a capital availability chart and see related indicators.
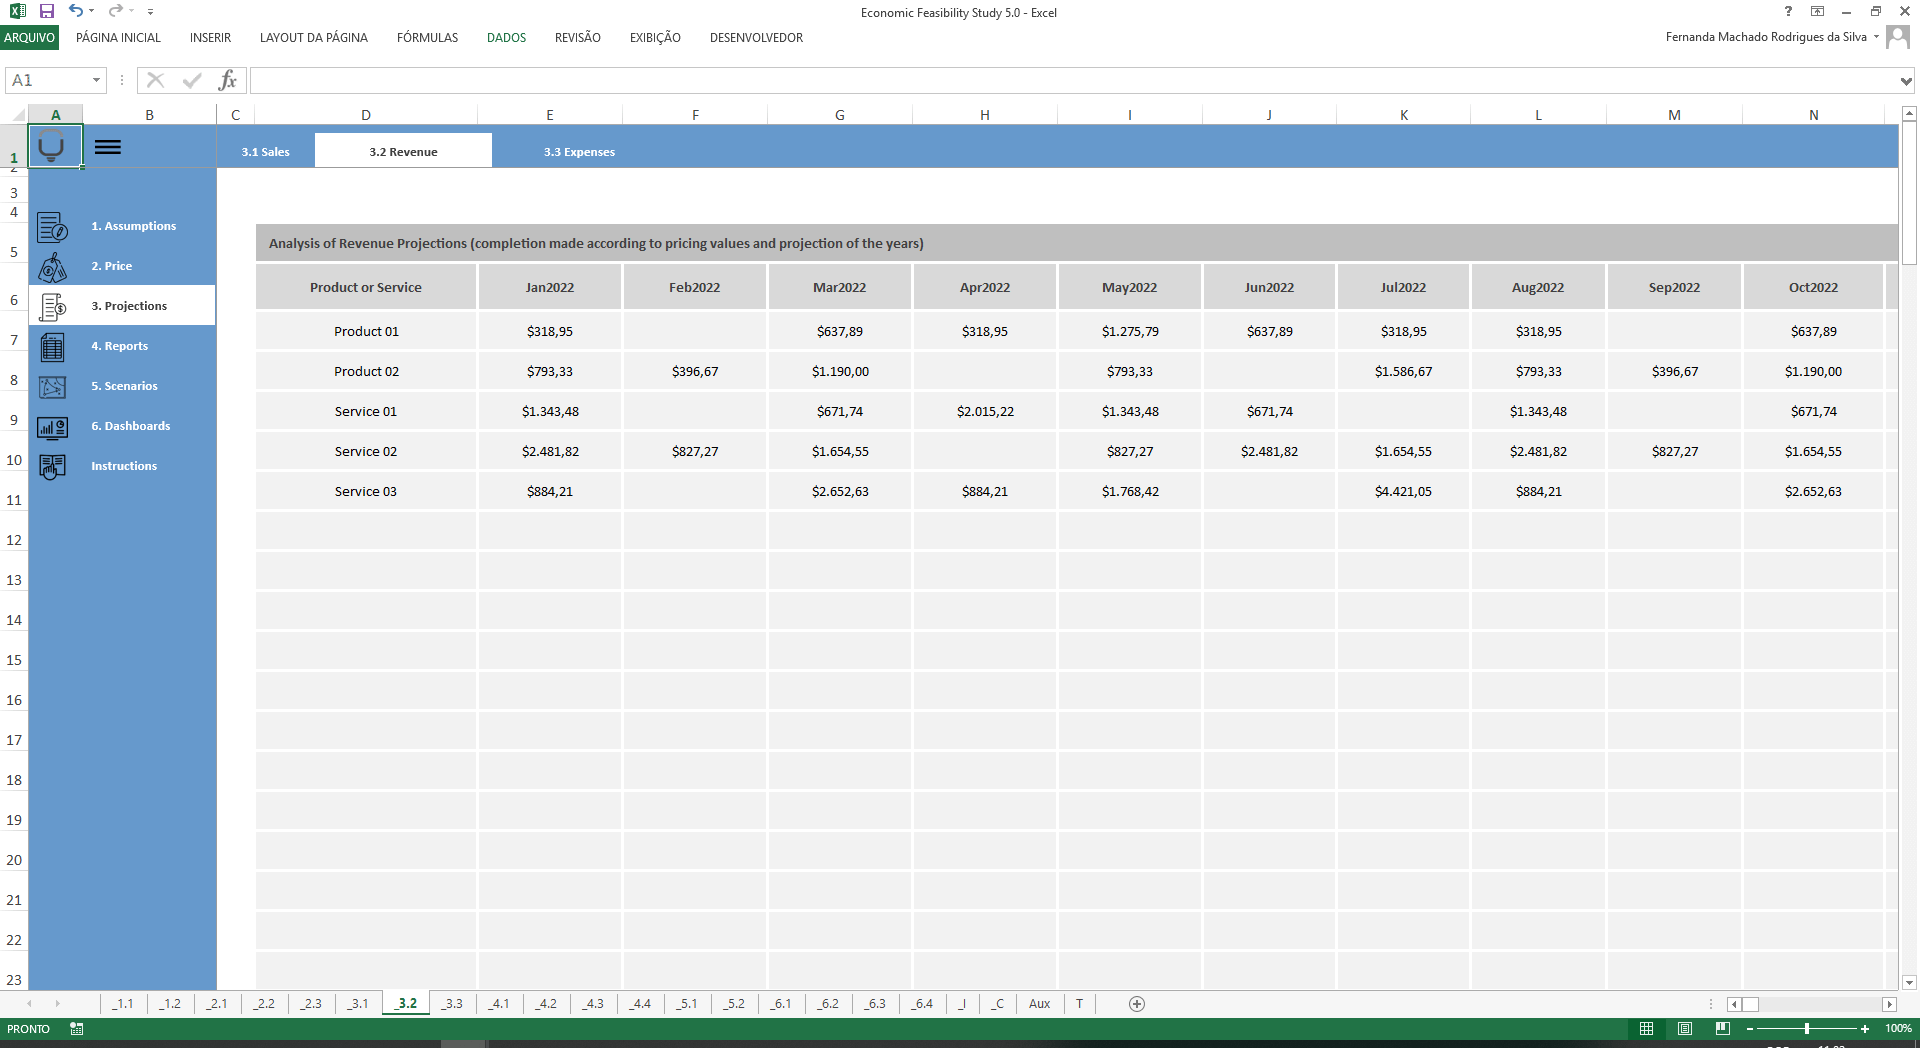
Pricing
Defining the price of your products and/or services is the first step to start making your sales projections and discover the feasibility of your idea, project or business.
Sales Projections
Set the projected sales quantity for each of the months of your feasibility study.
Fixed Costs
It is time to set all your fixed costs, including when they start and when they end. You can also set a recurring rate.
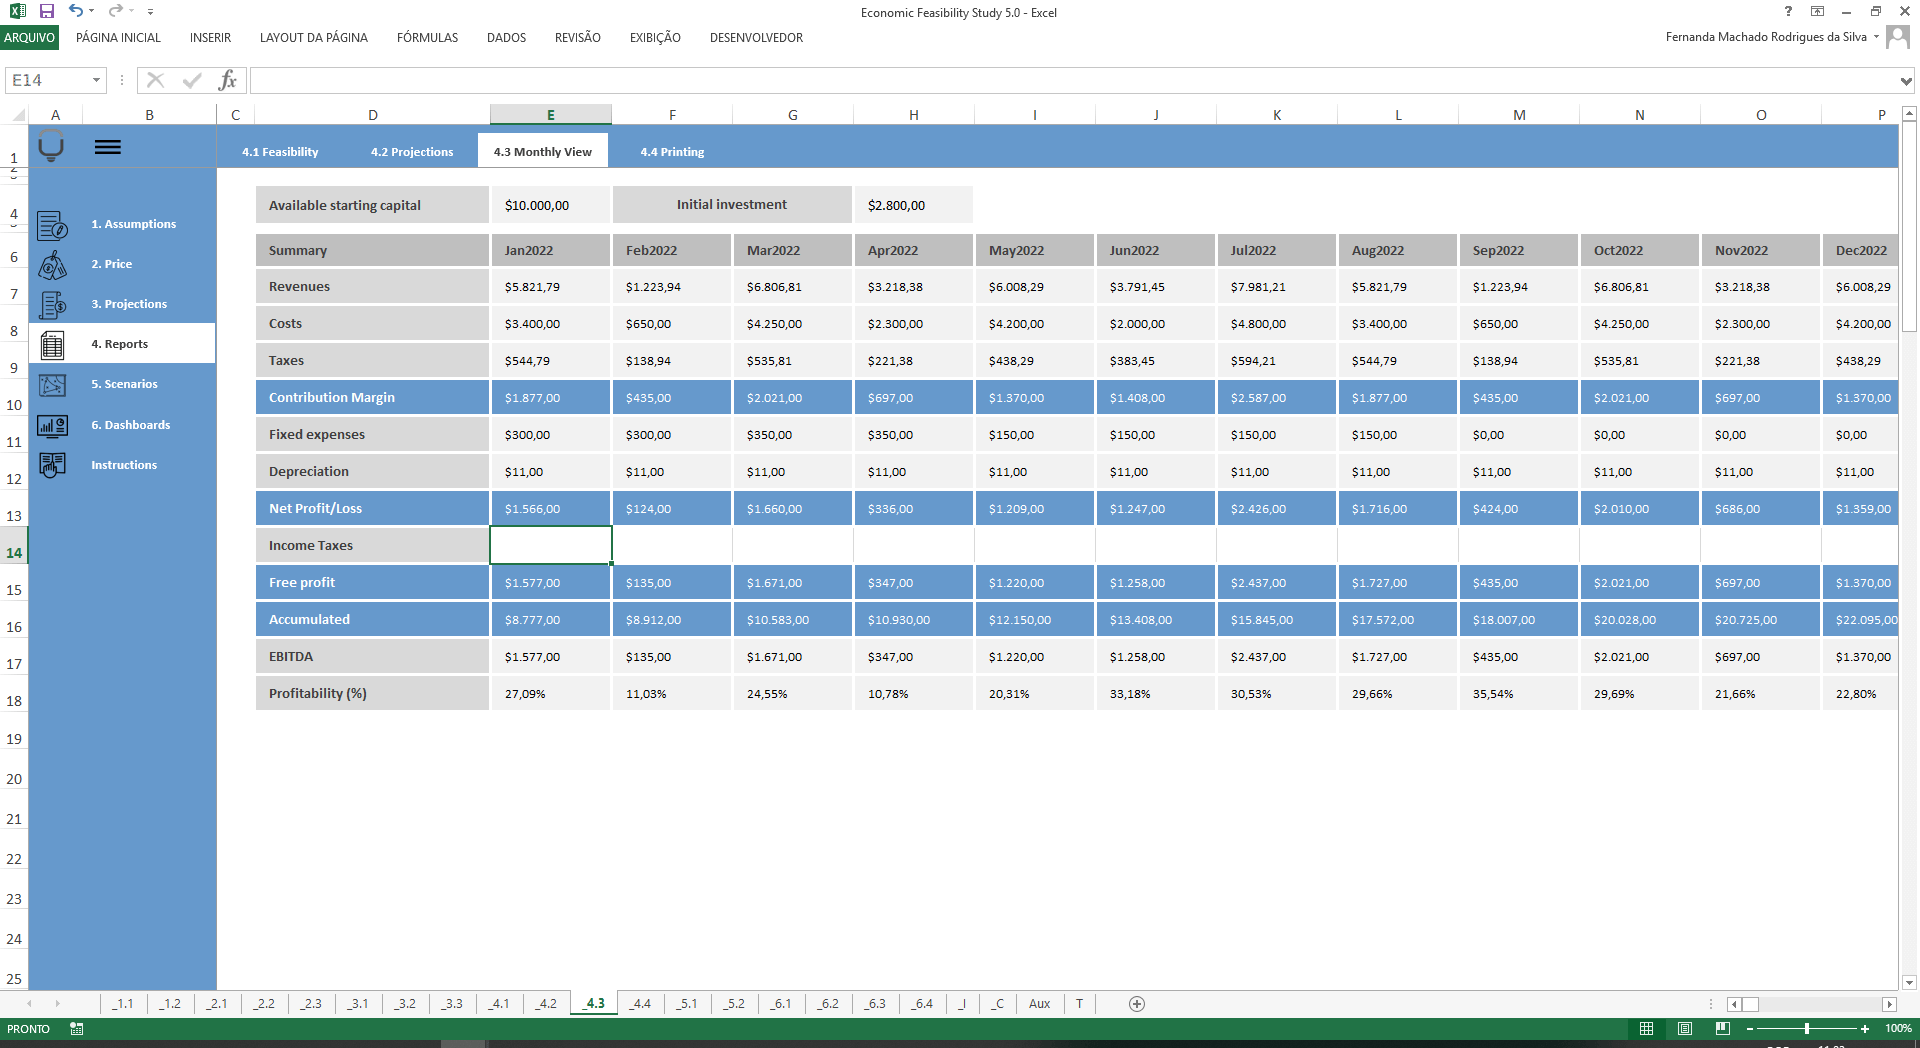
Projected Report
See your consolidated projection and key viability indicators: NPV, IRR, Discounted Payback and break even.
Capital Availability Monitoring
See month by month how your projected cash balance is to make sure it will not go negative during the period analyzed.
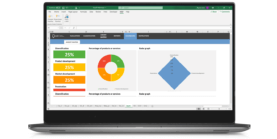
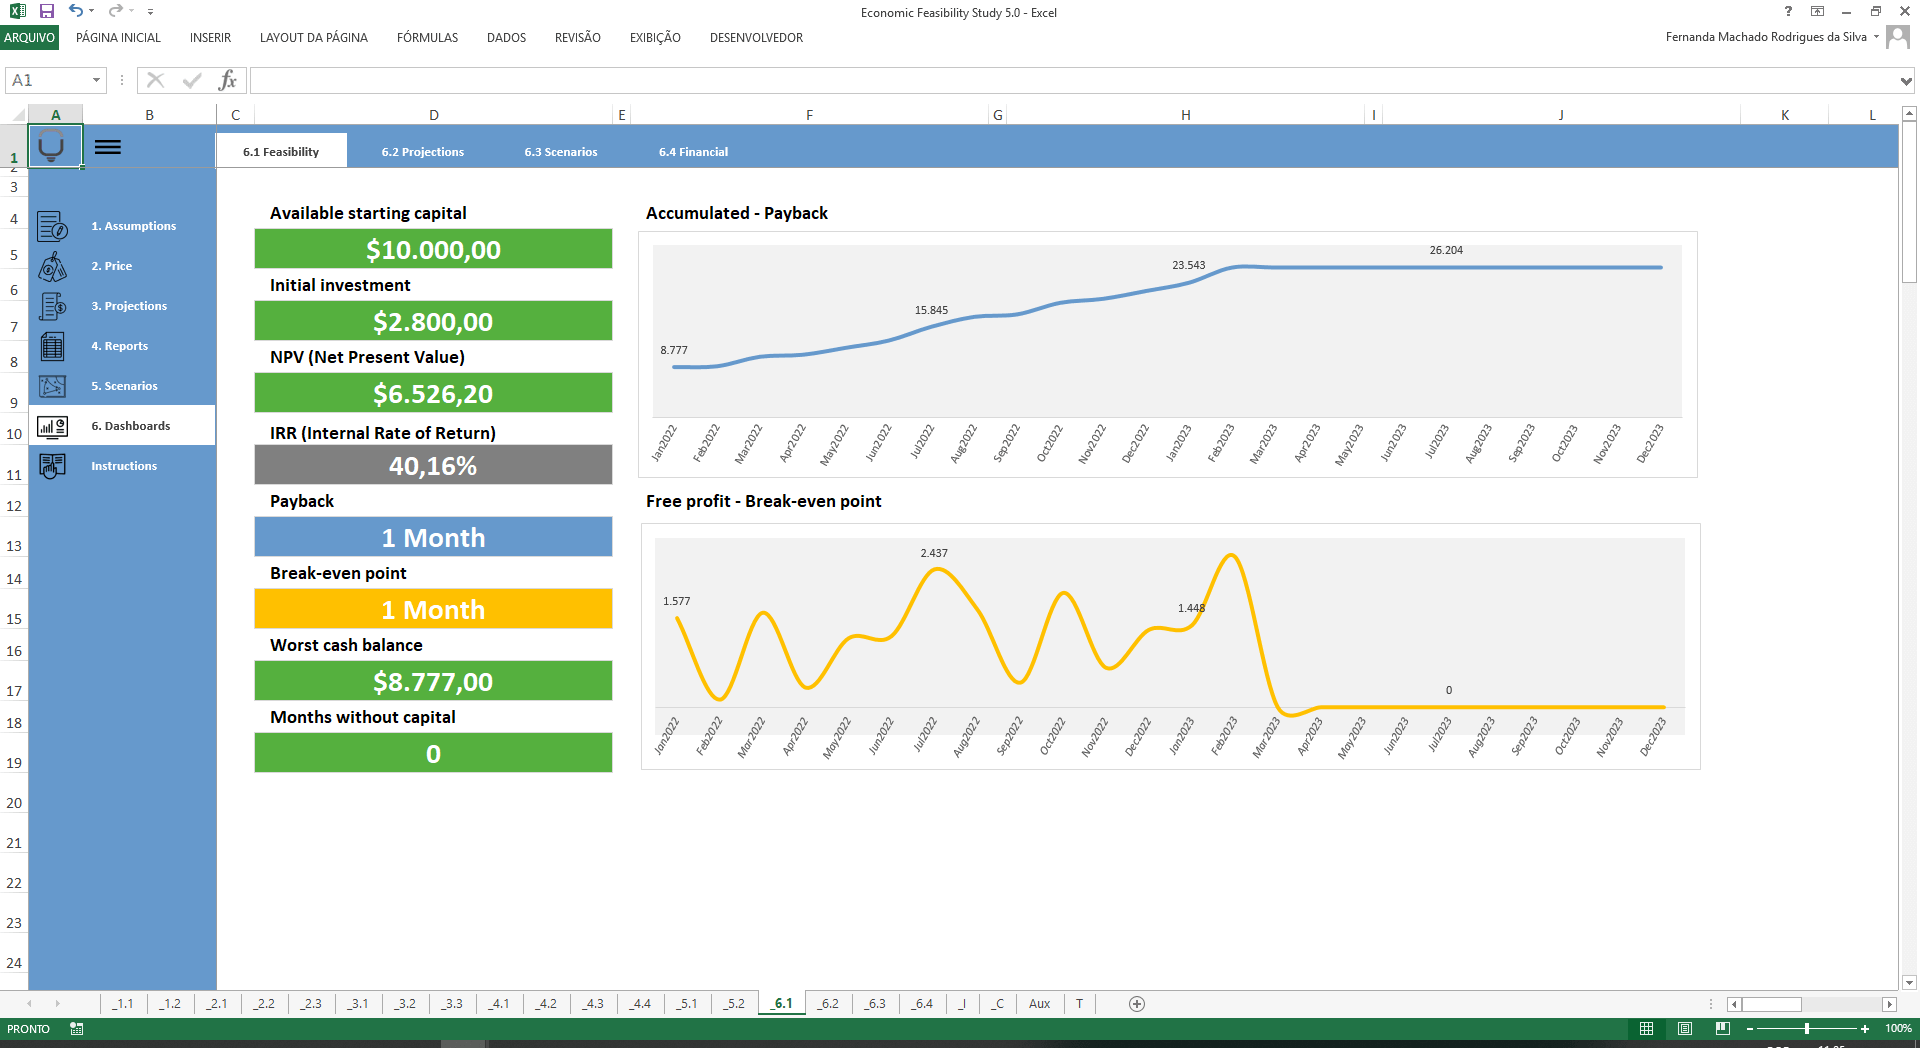
Feasibility Dashboard
Track the key indicators and viability charts (NPV, TIR and Discounted Payback) in a control panel.
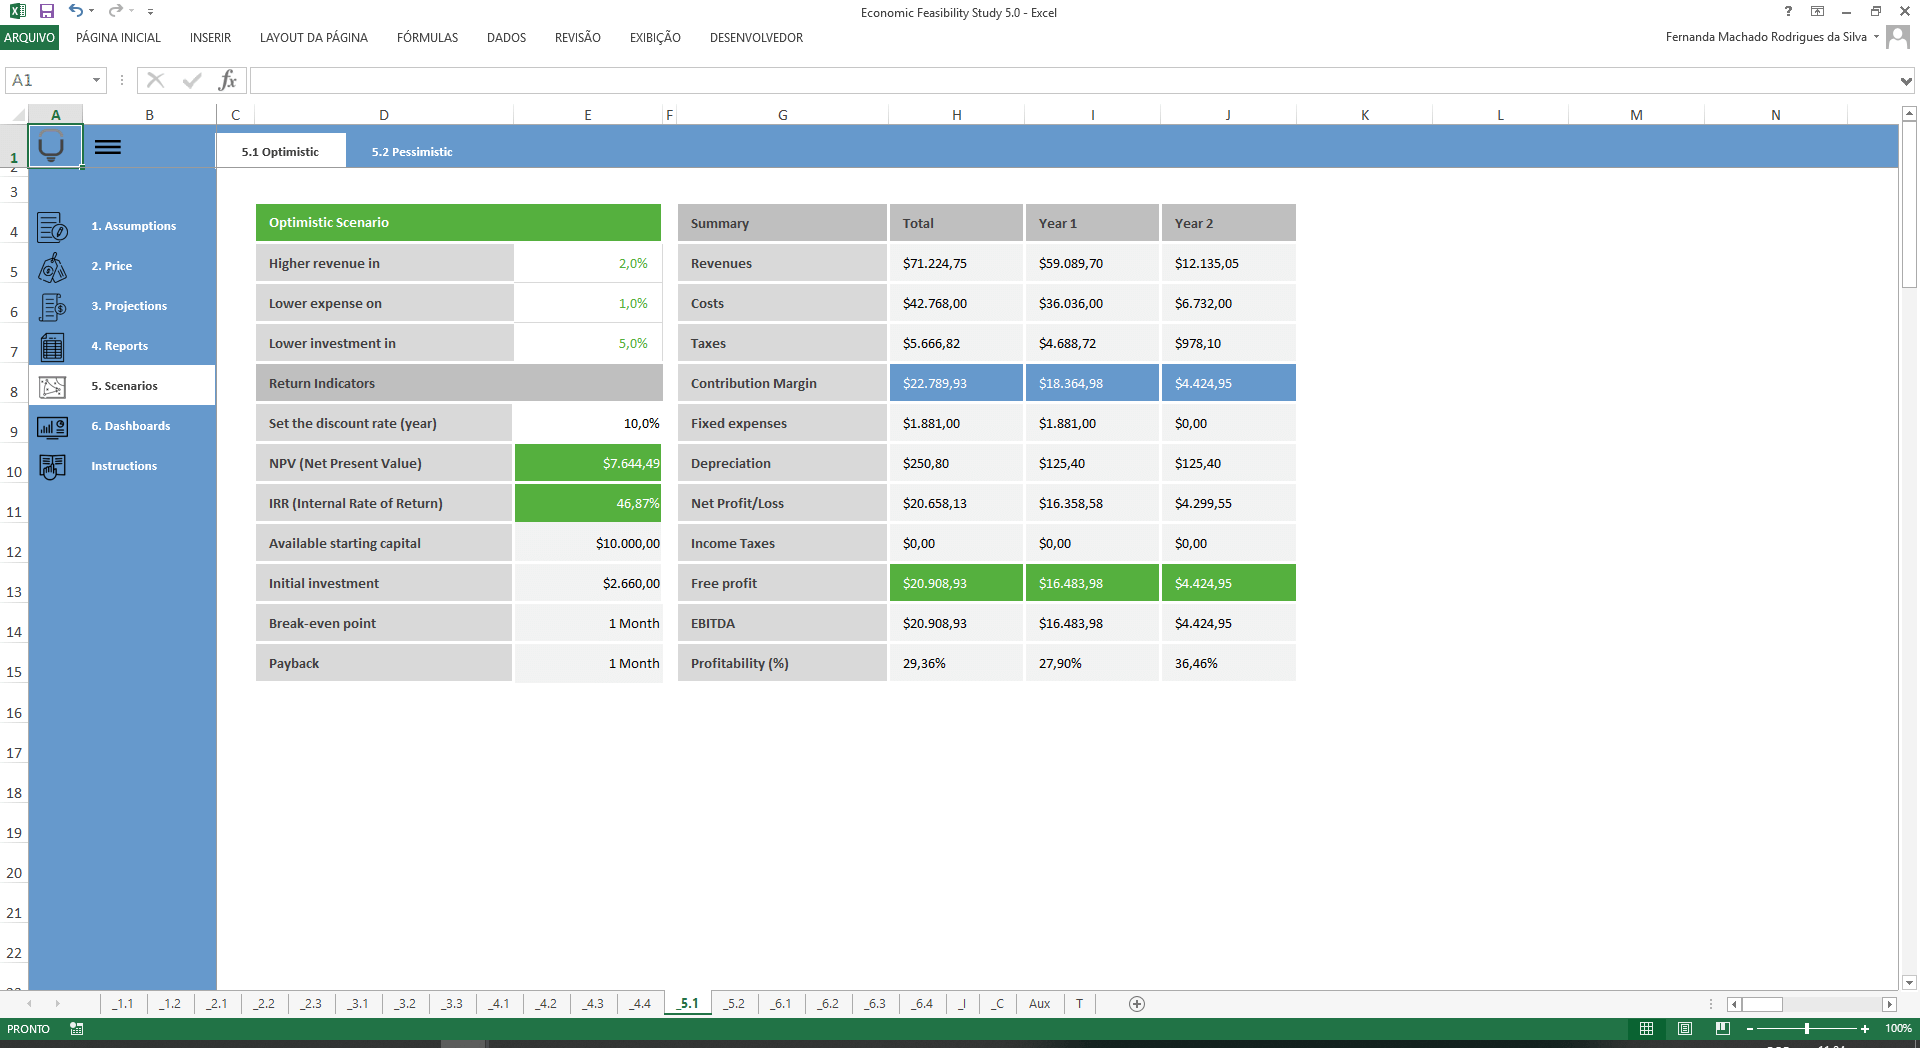
Optimistic Projection
Make an optimistic projection with ease, modifying important indicators of your project, such as income, costs and investments projections.
Pessimistic Projection
Make a pessimistic projection with ease, modifying important indicators of your project, such as income, costs and investments projections.
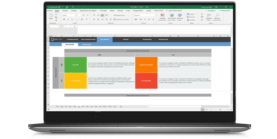
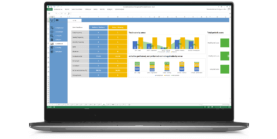
Scenario Comparison Dashboard
Quickly compare the result of realistic, pessimistic and optimistic projections to get an overview of your project possibilities.
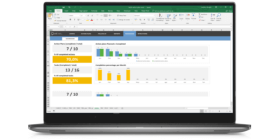
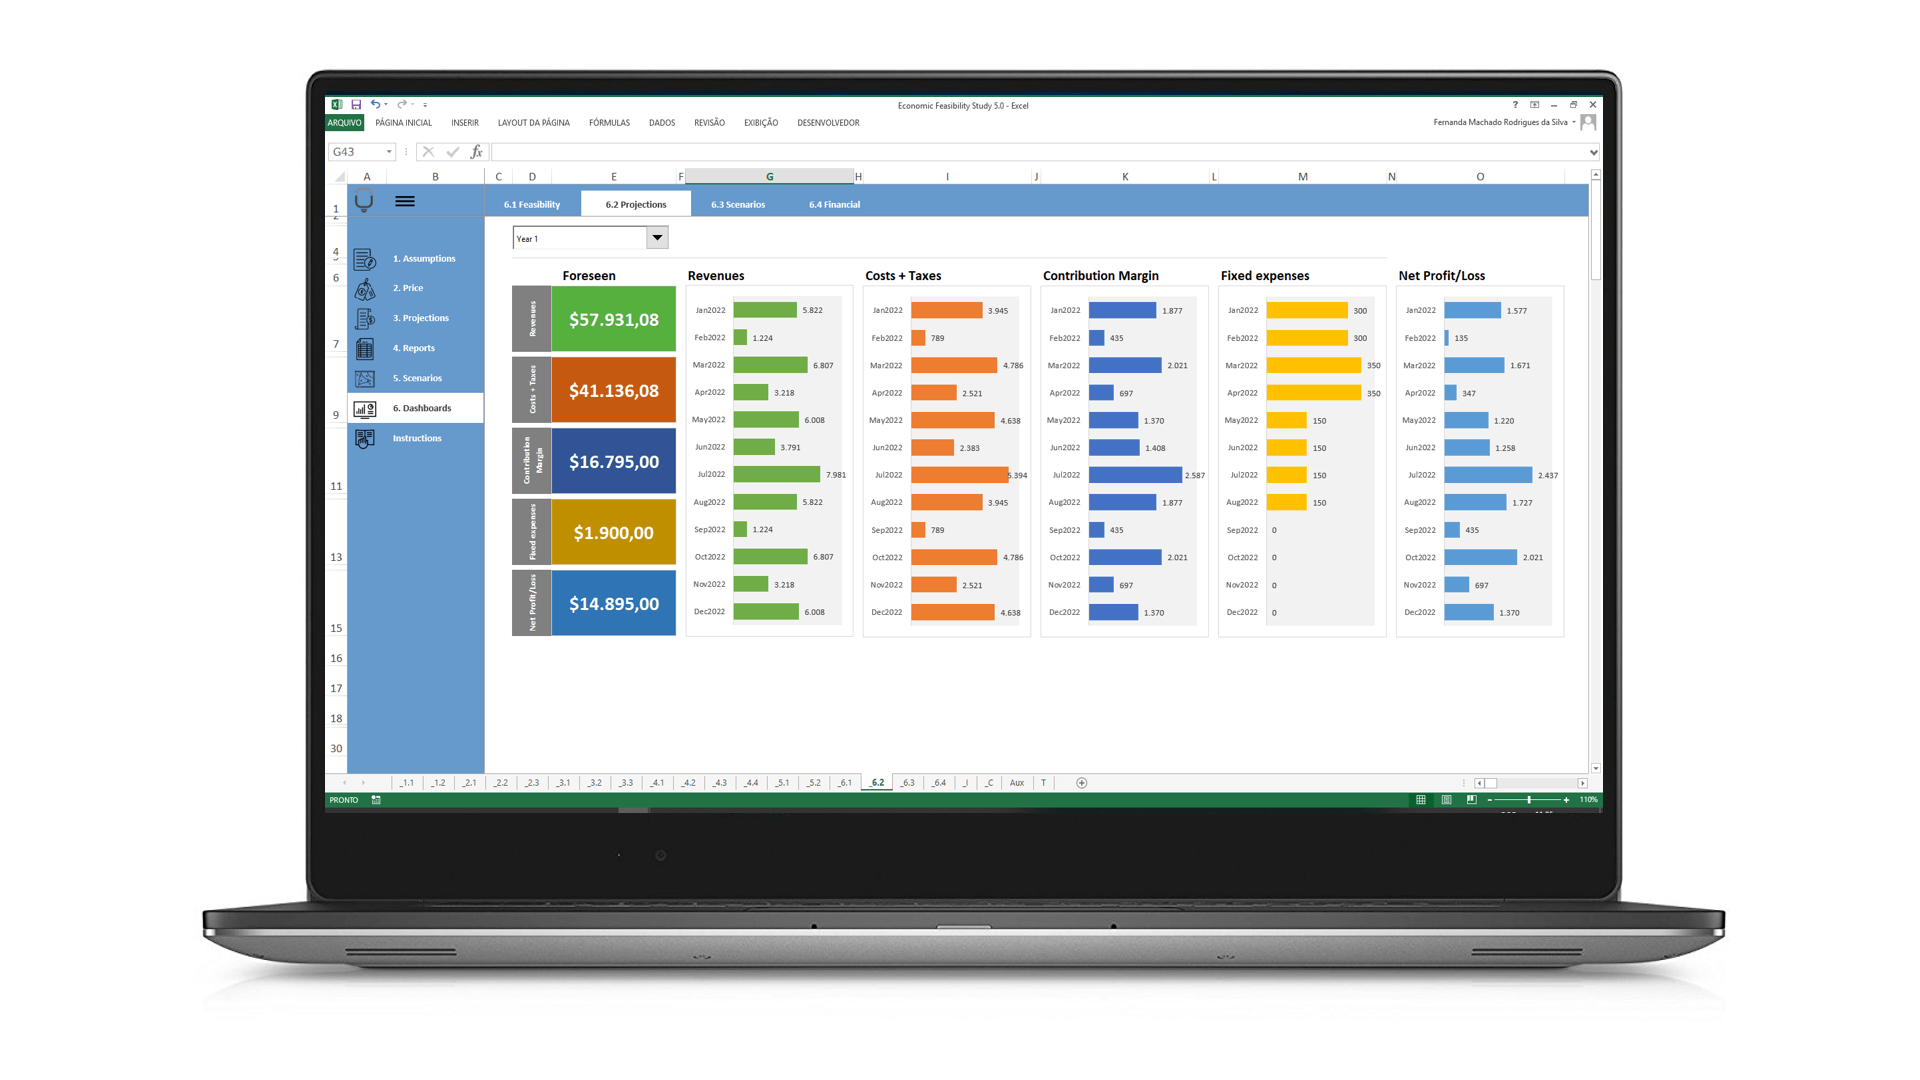
Projection Dashboard
Choose one of the years of your study and see important charts such as EBITDA versus free profit or the comparison of expenses in the year in question.
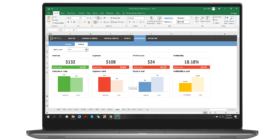
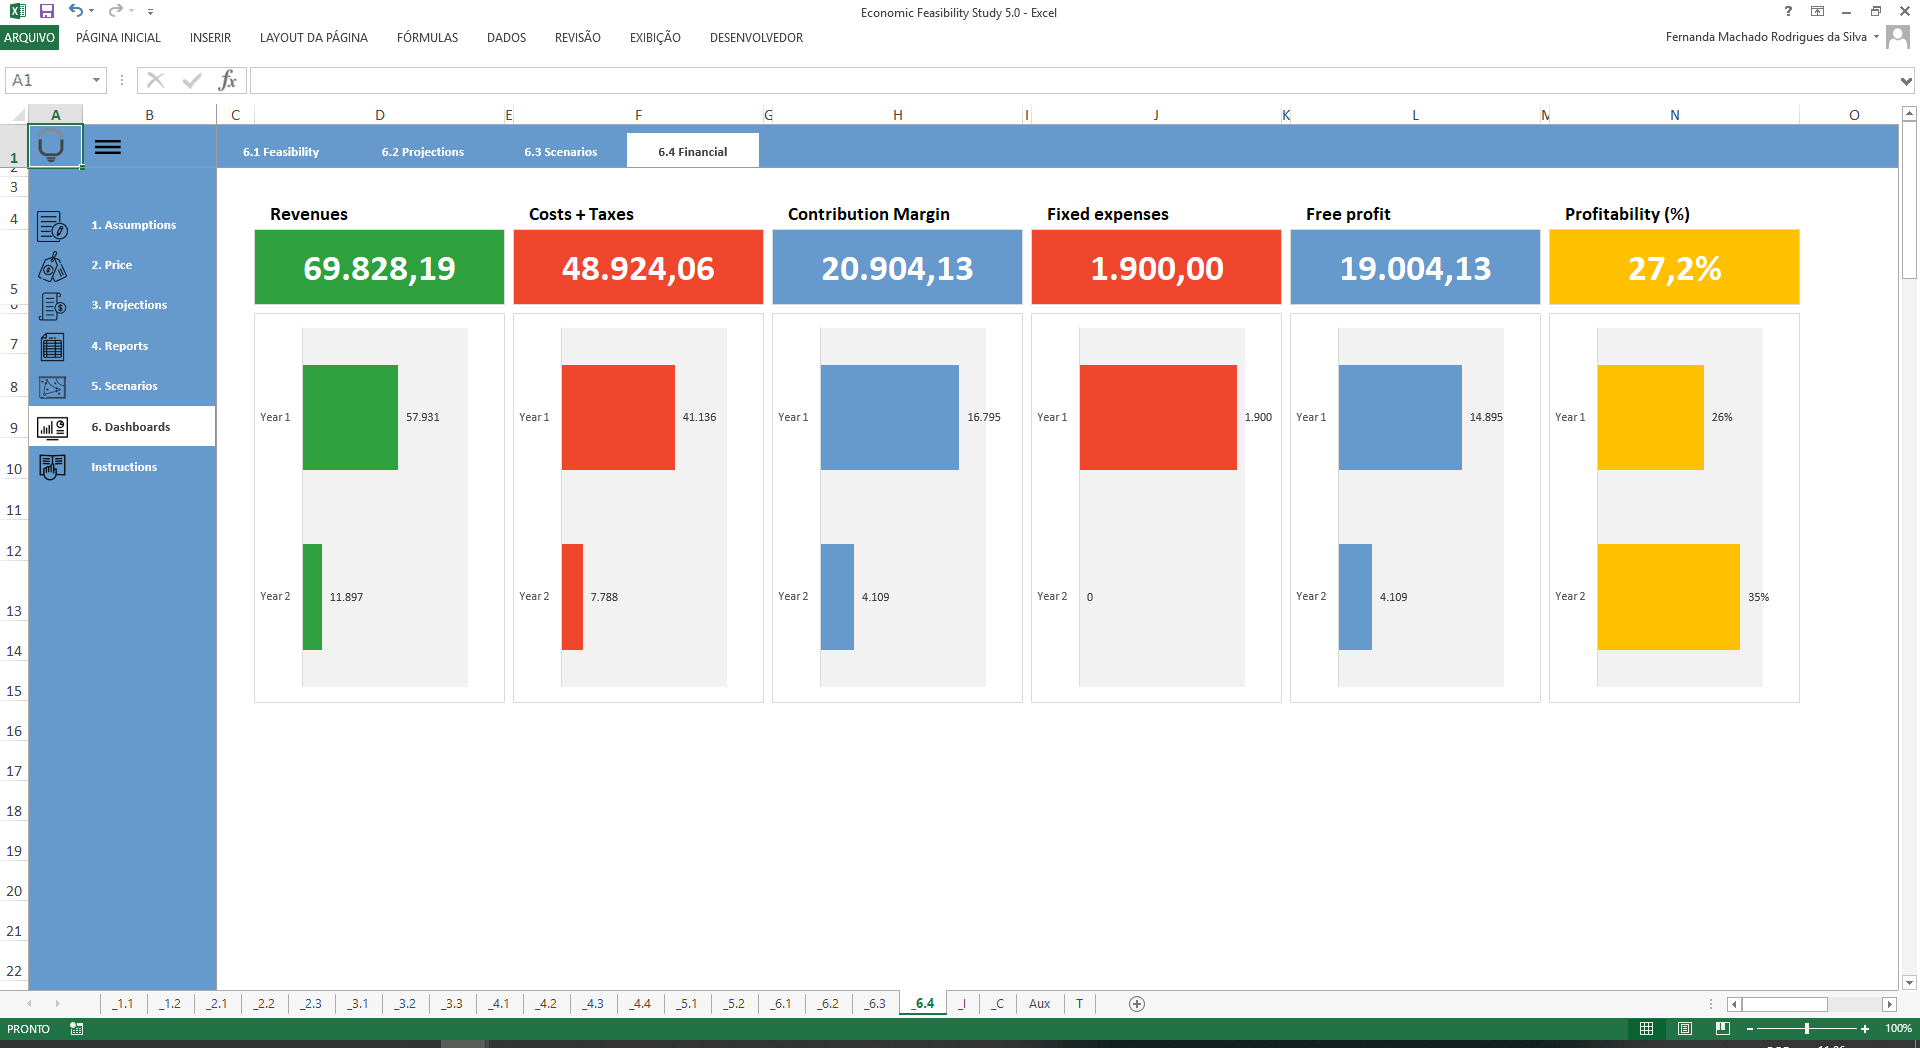
Financial Dashboard
According to the data placed in the initial parts of the spreadsheet, see a control panel with your main projected financial information.
Financial Business Feasibility Study Excel Spreadsheet Template
Similar templates
LUZ Templates is a subscription club with the world’s largest selection of spreadsheet templates for managers, business consultants, and owners.